Community
All Ears Petcare
This nonprofit has established effective manual processes, but there's an opportunity to innovate and reduce the time spent on repetitive tasks.
View Prototype
Timeline:
Aug 2017 - Mar 2025
Role:
Founder
Behavior Analyst, UXR
Tools Used:
Honeybook
Airtable
Loom
Teachable
Key Skills:
Project Management
Data visualization
User Research Studies
Problem
This internal dashboard was created for Northwest Wag Rescue an all volunteer ran foster-based rescue helping high-kill shelter dogs in Mexico to get transported and adopted in their furever homes in PNW!
They have an existing website and established brand identity. Their biggest growth struggle is communication and growing their volunteer base.
Communications were split between Whatsapp, Facebook, and individual group messages. This is causing a lot of stress on the owner.
Their current system streamlines a lot of the dog's adoption process, but the main bottleneck is application of and task management among volunteers.
The owner dreams about hosting bigger adoption events like 5k, and accepting donations, but right now she's so stretched thin.
"I have to call or email support to update it." - Remarks from owner
Process Plan
I interviewed 5 dog rescue volunteers and nonprofit owners to understand the unique challenges. I began by separating interview responses into two categories:
what users currently experience and
what they actually need.
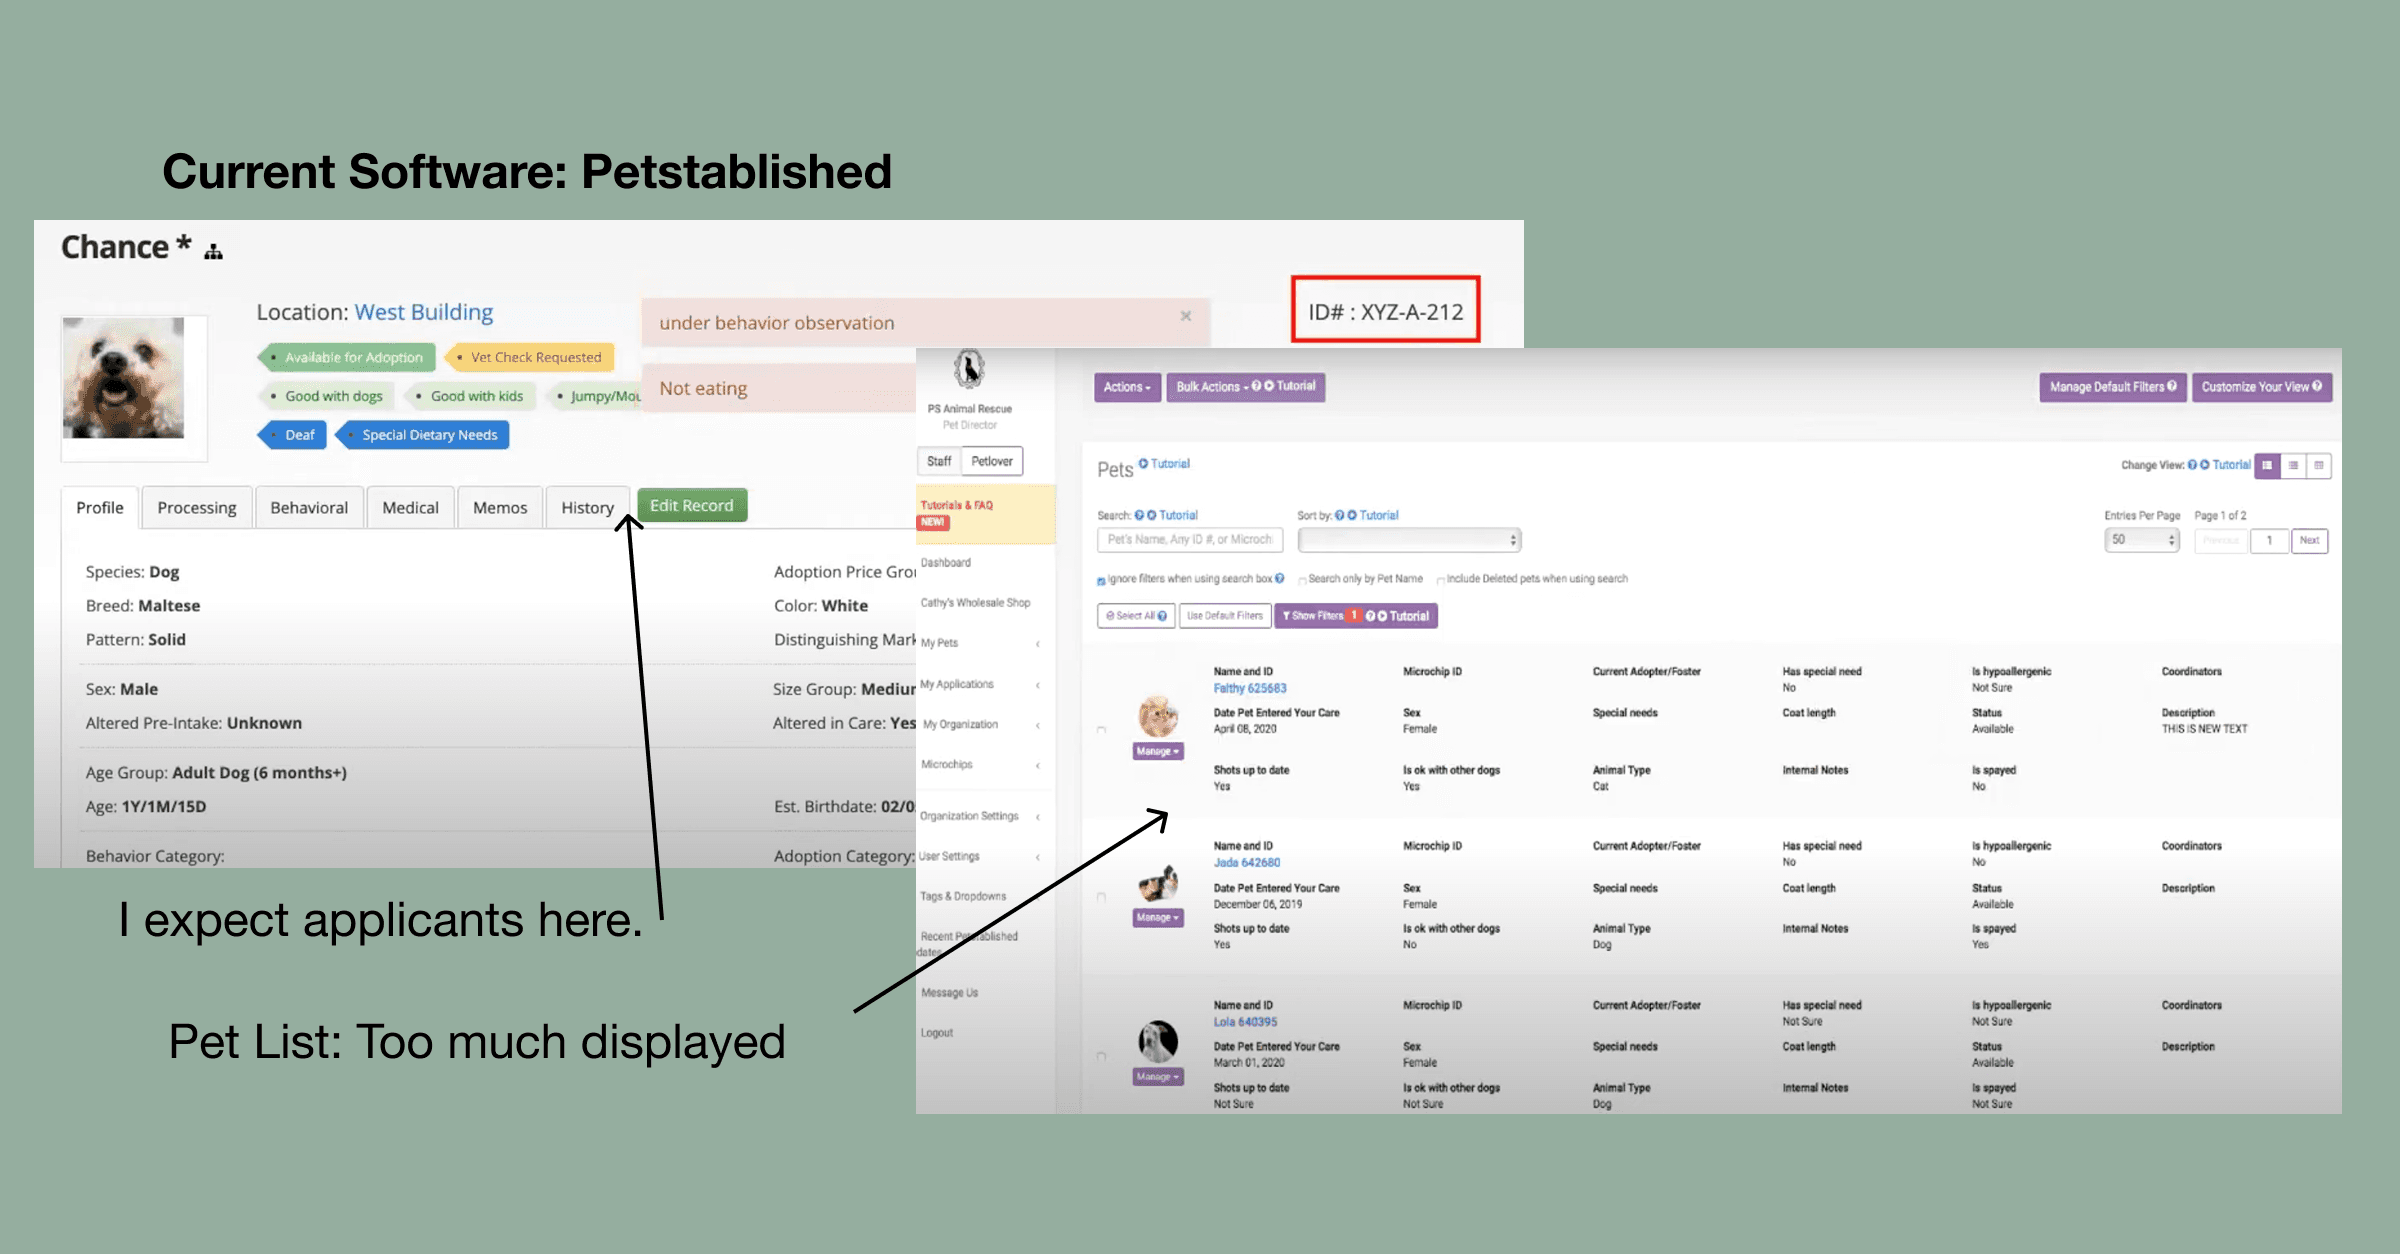
This helped uncover gaps between existing workflows and ideal outcomes. A competitor analysis and review of the nonprofit’s current software revealed two key issues:
tools were either overloaded with irrelevant sections or
overwhelmed users with too much information at once.
This led to slower task completion and unnecessary complexity for a team that needed clarity and speed.
Alongside interviews and software analysis, I also drew on my background as a former dog trainer. That experience gave me a unique perspective on the real-life needs of rescues—like the importance of clearly tracking behavior notes, medical updates, and volunteer communication around a dog’s daily care.
User flows right to left. with a "popup" or highlight pulled forward to see.
While user flows for adopting a dog were well-documented, I found little guidance for managing a rescue internal workflows. To bridge this gap, I created detailed user flows, a customer journey map, and a sitemap that reflect the full scope of daily operations.
These insights led two distinct personas: 1) focused on simplicity and quick task management, and 2) needing in-depth insights into volunteer progress and team availability.
I chose to focus on Lisa, the nonprofit owner, and create a streamlined dashboard that prioritized the most critical tasks and data for her role.
Strategic Review
90 day reviews and annual check-ins.
Time it takes: ___ hours
written up.
Launch: Hybrid Dog Training, 2023 - 2024
Teachable, loom, and instagram storiesc
What does the nonprofit owner need to see first to start her day with confidence?
Key Insights:
Polling on "Dogs" Expanded View: Collected feedback to refine the layout and user experience.
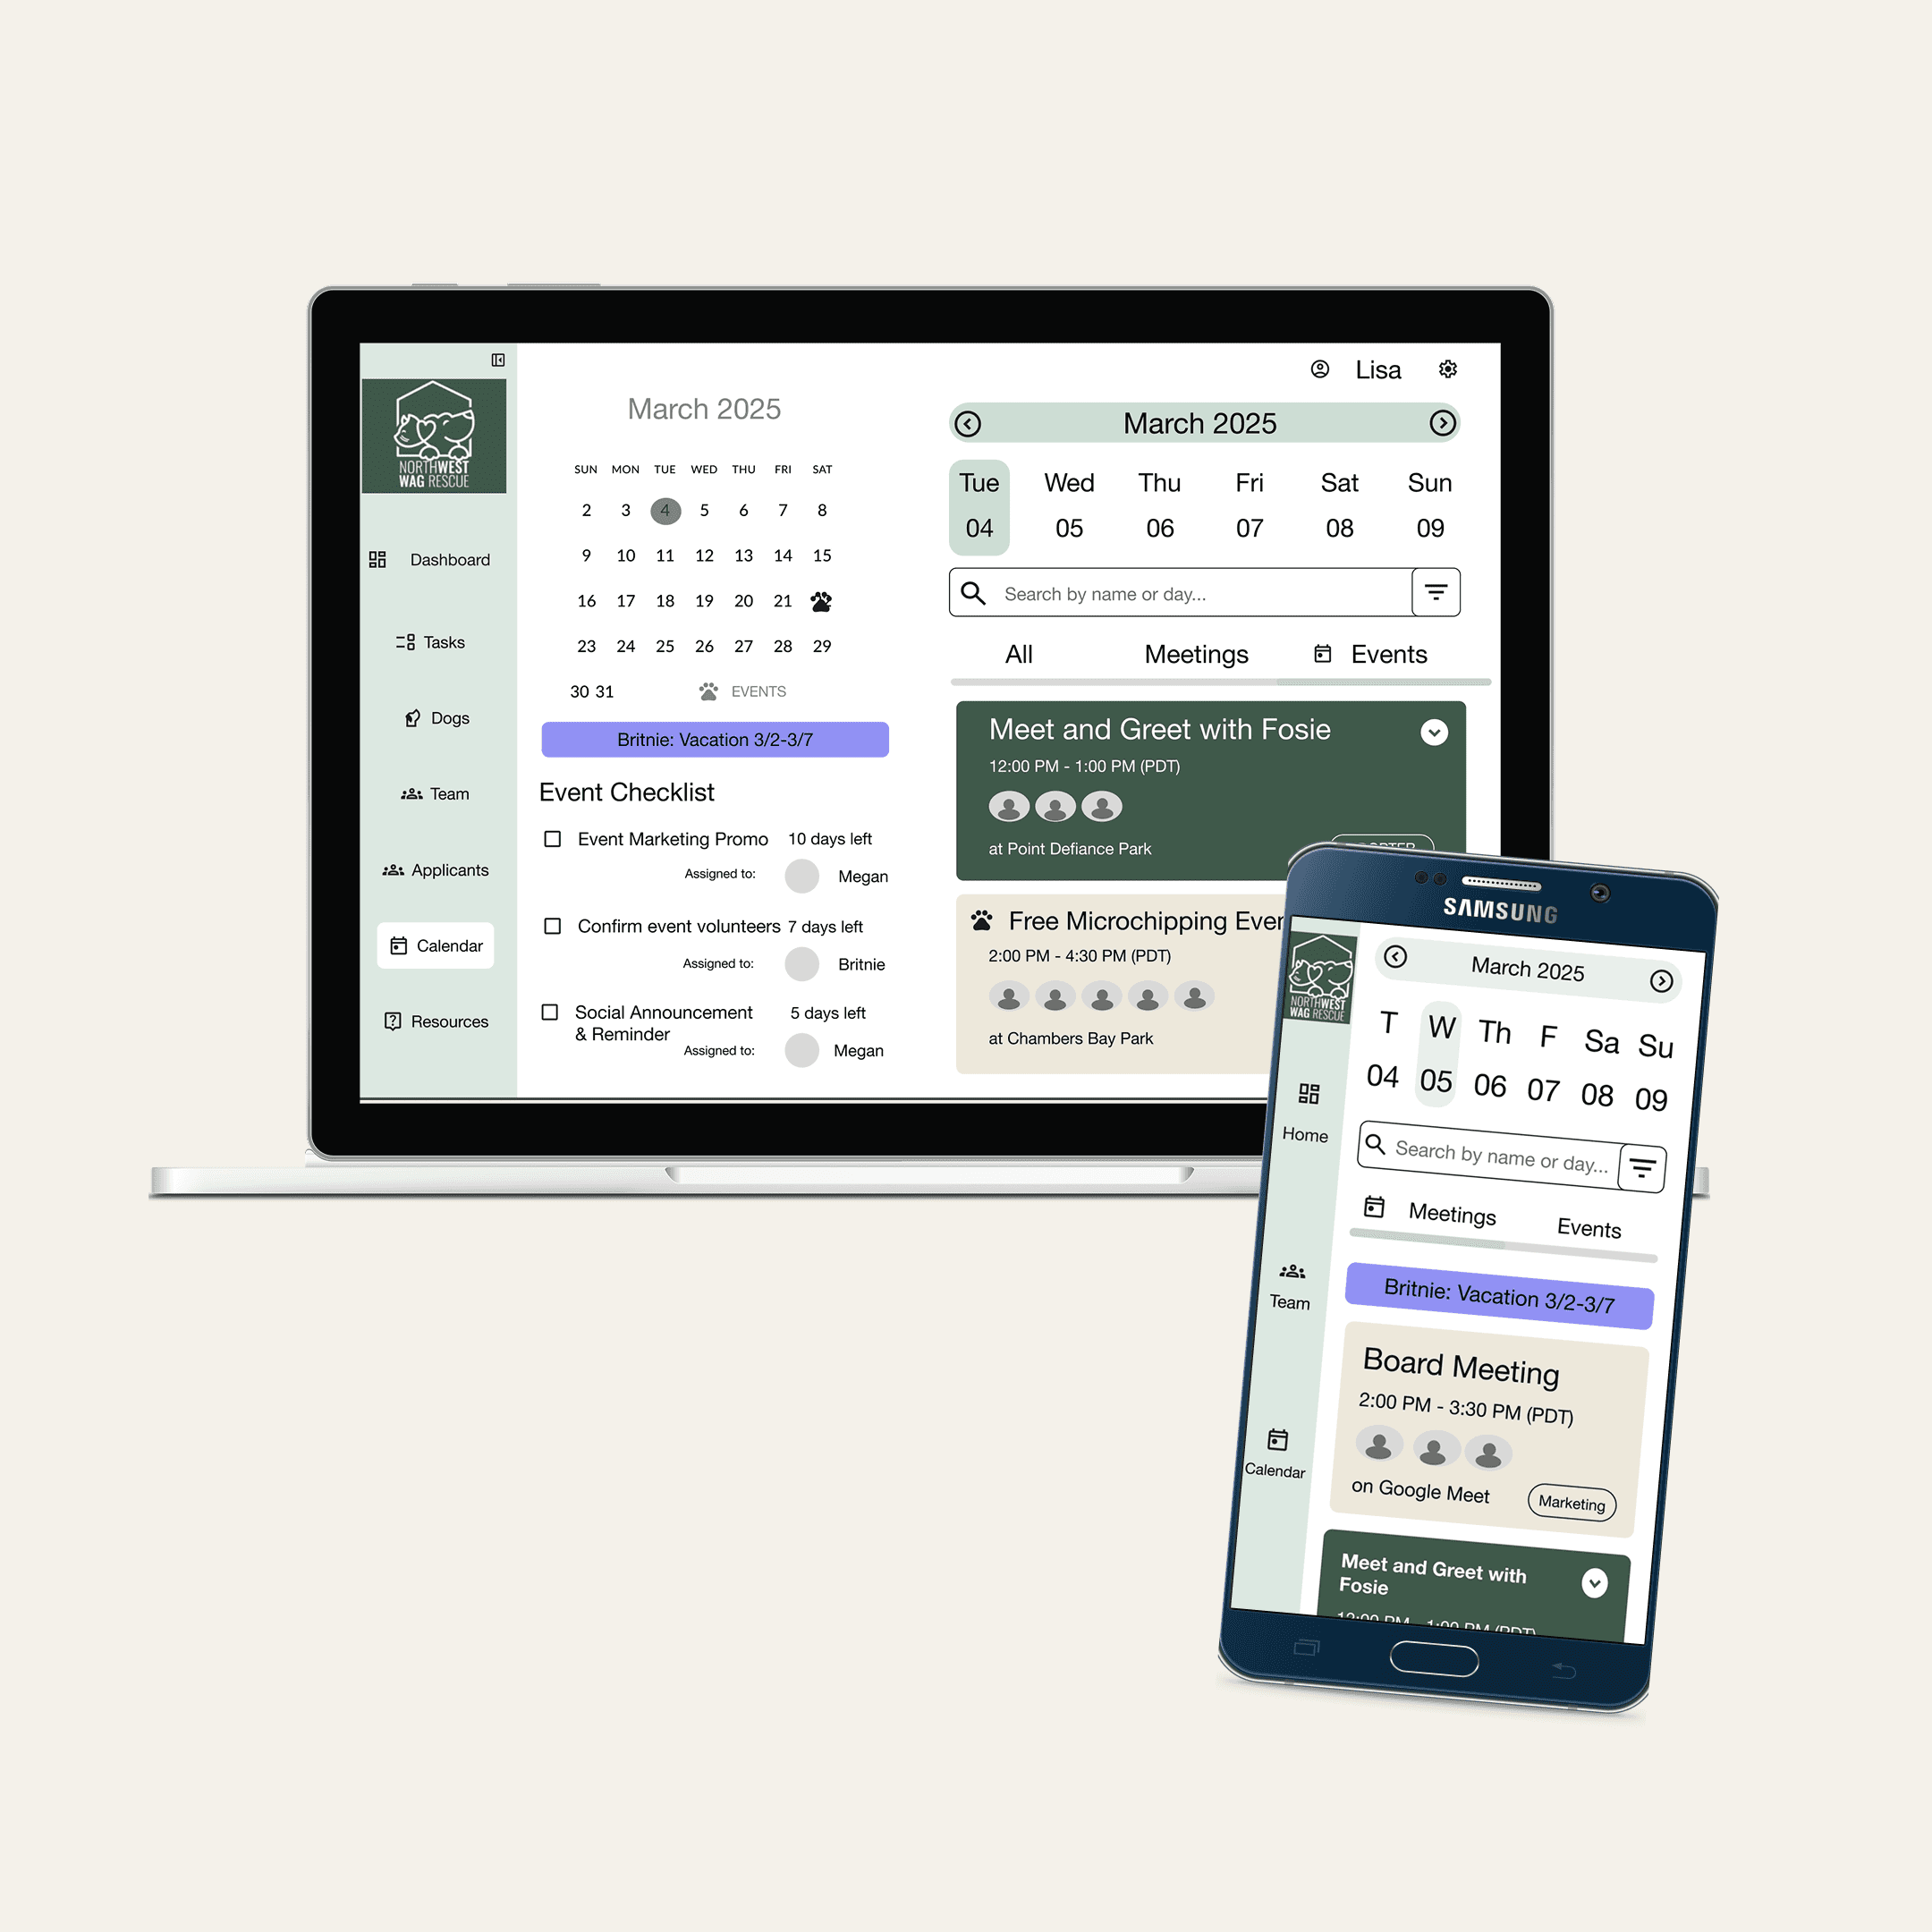
A/B Test on Events Layout:
Tested two options: a single daily view versus a combined daily/monthly view with assigned marketing tasks.
Result: 43% of participants preferred the simplicity of the daily calendar view.
I refined the side navigation by changing “People” to “Team” and “Applicants” to enhance clarity and improve navigation.
To visually distinguish between users and dogs, I designed dog profiles to be long and horizontal, giving space for behavior notes and adoption status. In contrast, team and applicant cards are vertical, with action buttons stacked beneath each name for quick task assignment.
The nonprofit had an existing brand identity, including fonts and colors. Initially, light green was chosen for primary actions, but during testing, orange provided better visual contrast and helped guide task completion.
Iterations
I tested the dashboard with 7 participants, including 3 current volunteers from the rescue. Feedback focused on clarity between action buttons and status indicators. Many users struggled to distinguish the two. Based on this, I cleaned up the UI to visually separate interactive buttons from static status labels.
Key outcomes from testing:
93% of participants rated the experience 5/5 on the Likert scale for Ease of Use
0 critical errors were recorded
100% of users said tasks took less time than expected
Previously, some tasks took over 5 minutes and required back-and-forth communication. During testing, most tasks were completed in under 1 minute, with only 3 tasks taking close to 3 minutes, out of 28 tasks.
The owner was surprised by how much time was saved using pre-set task options
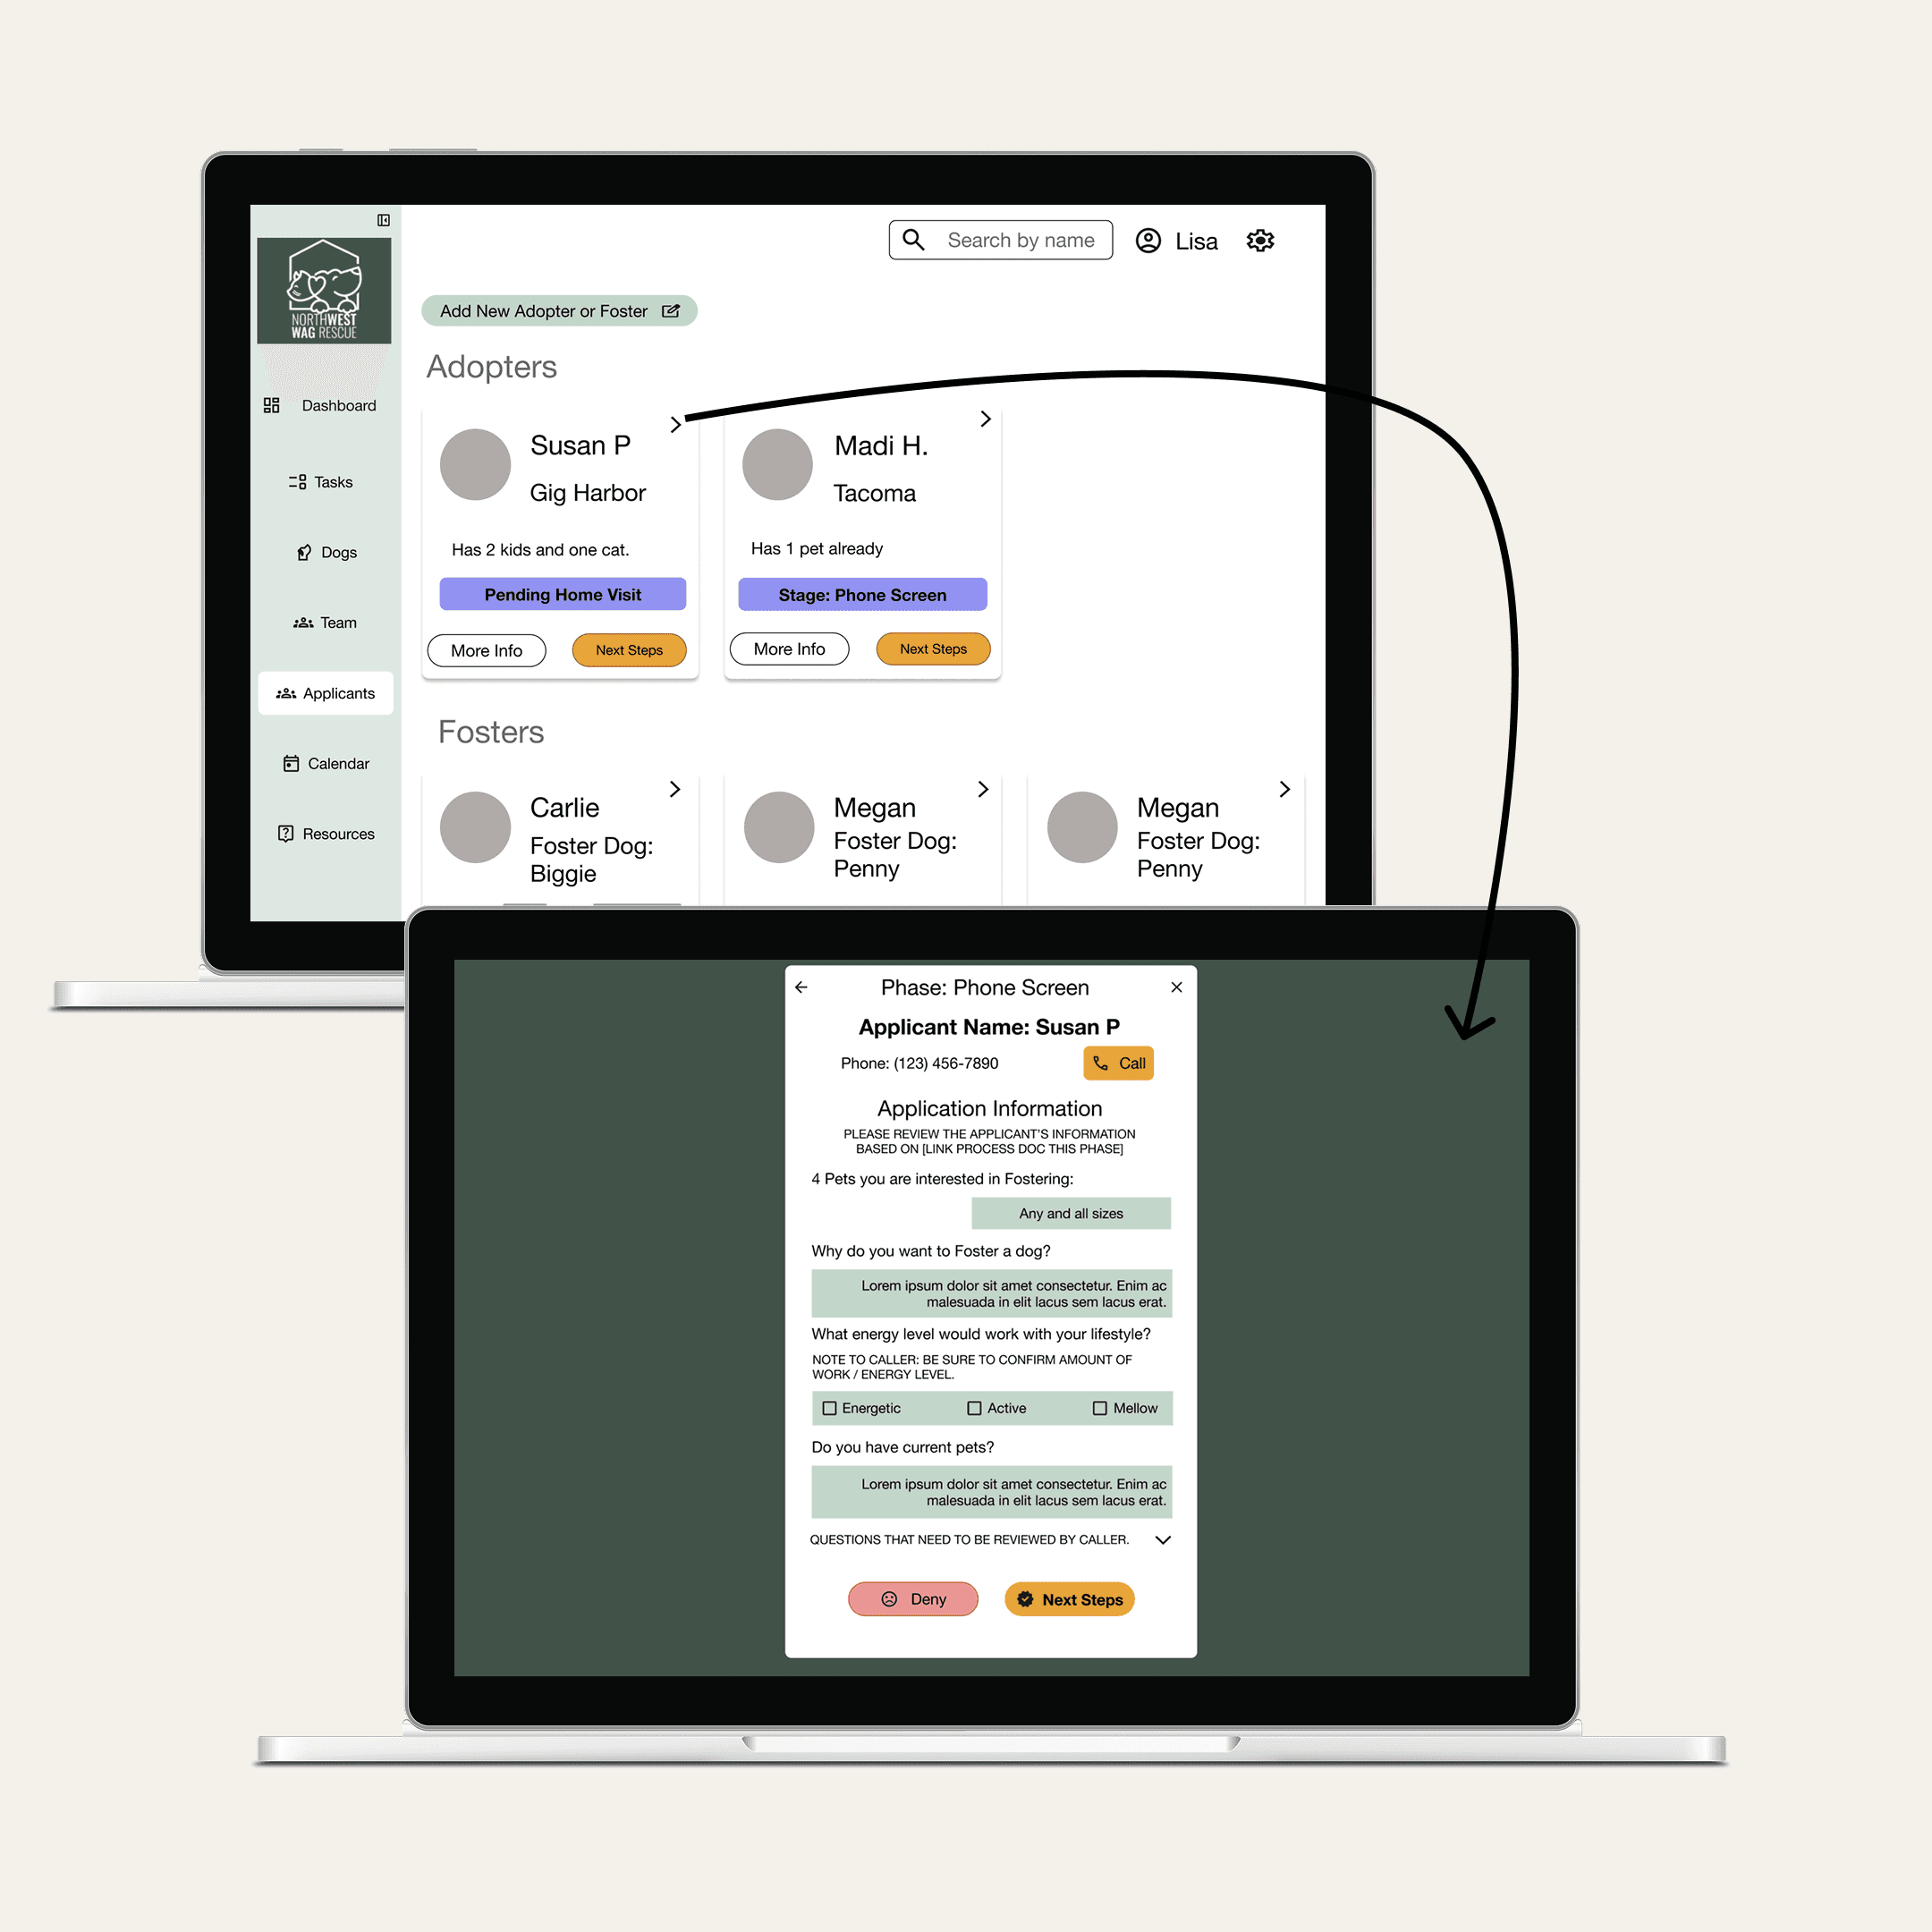
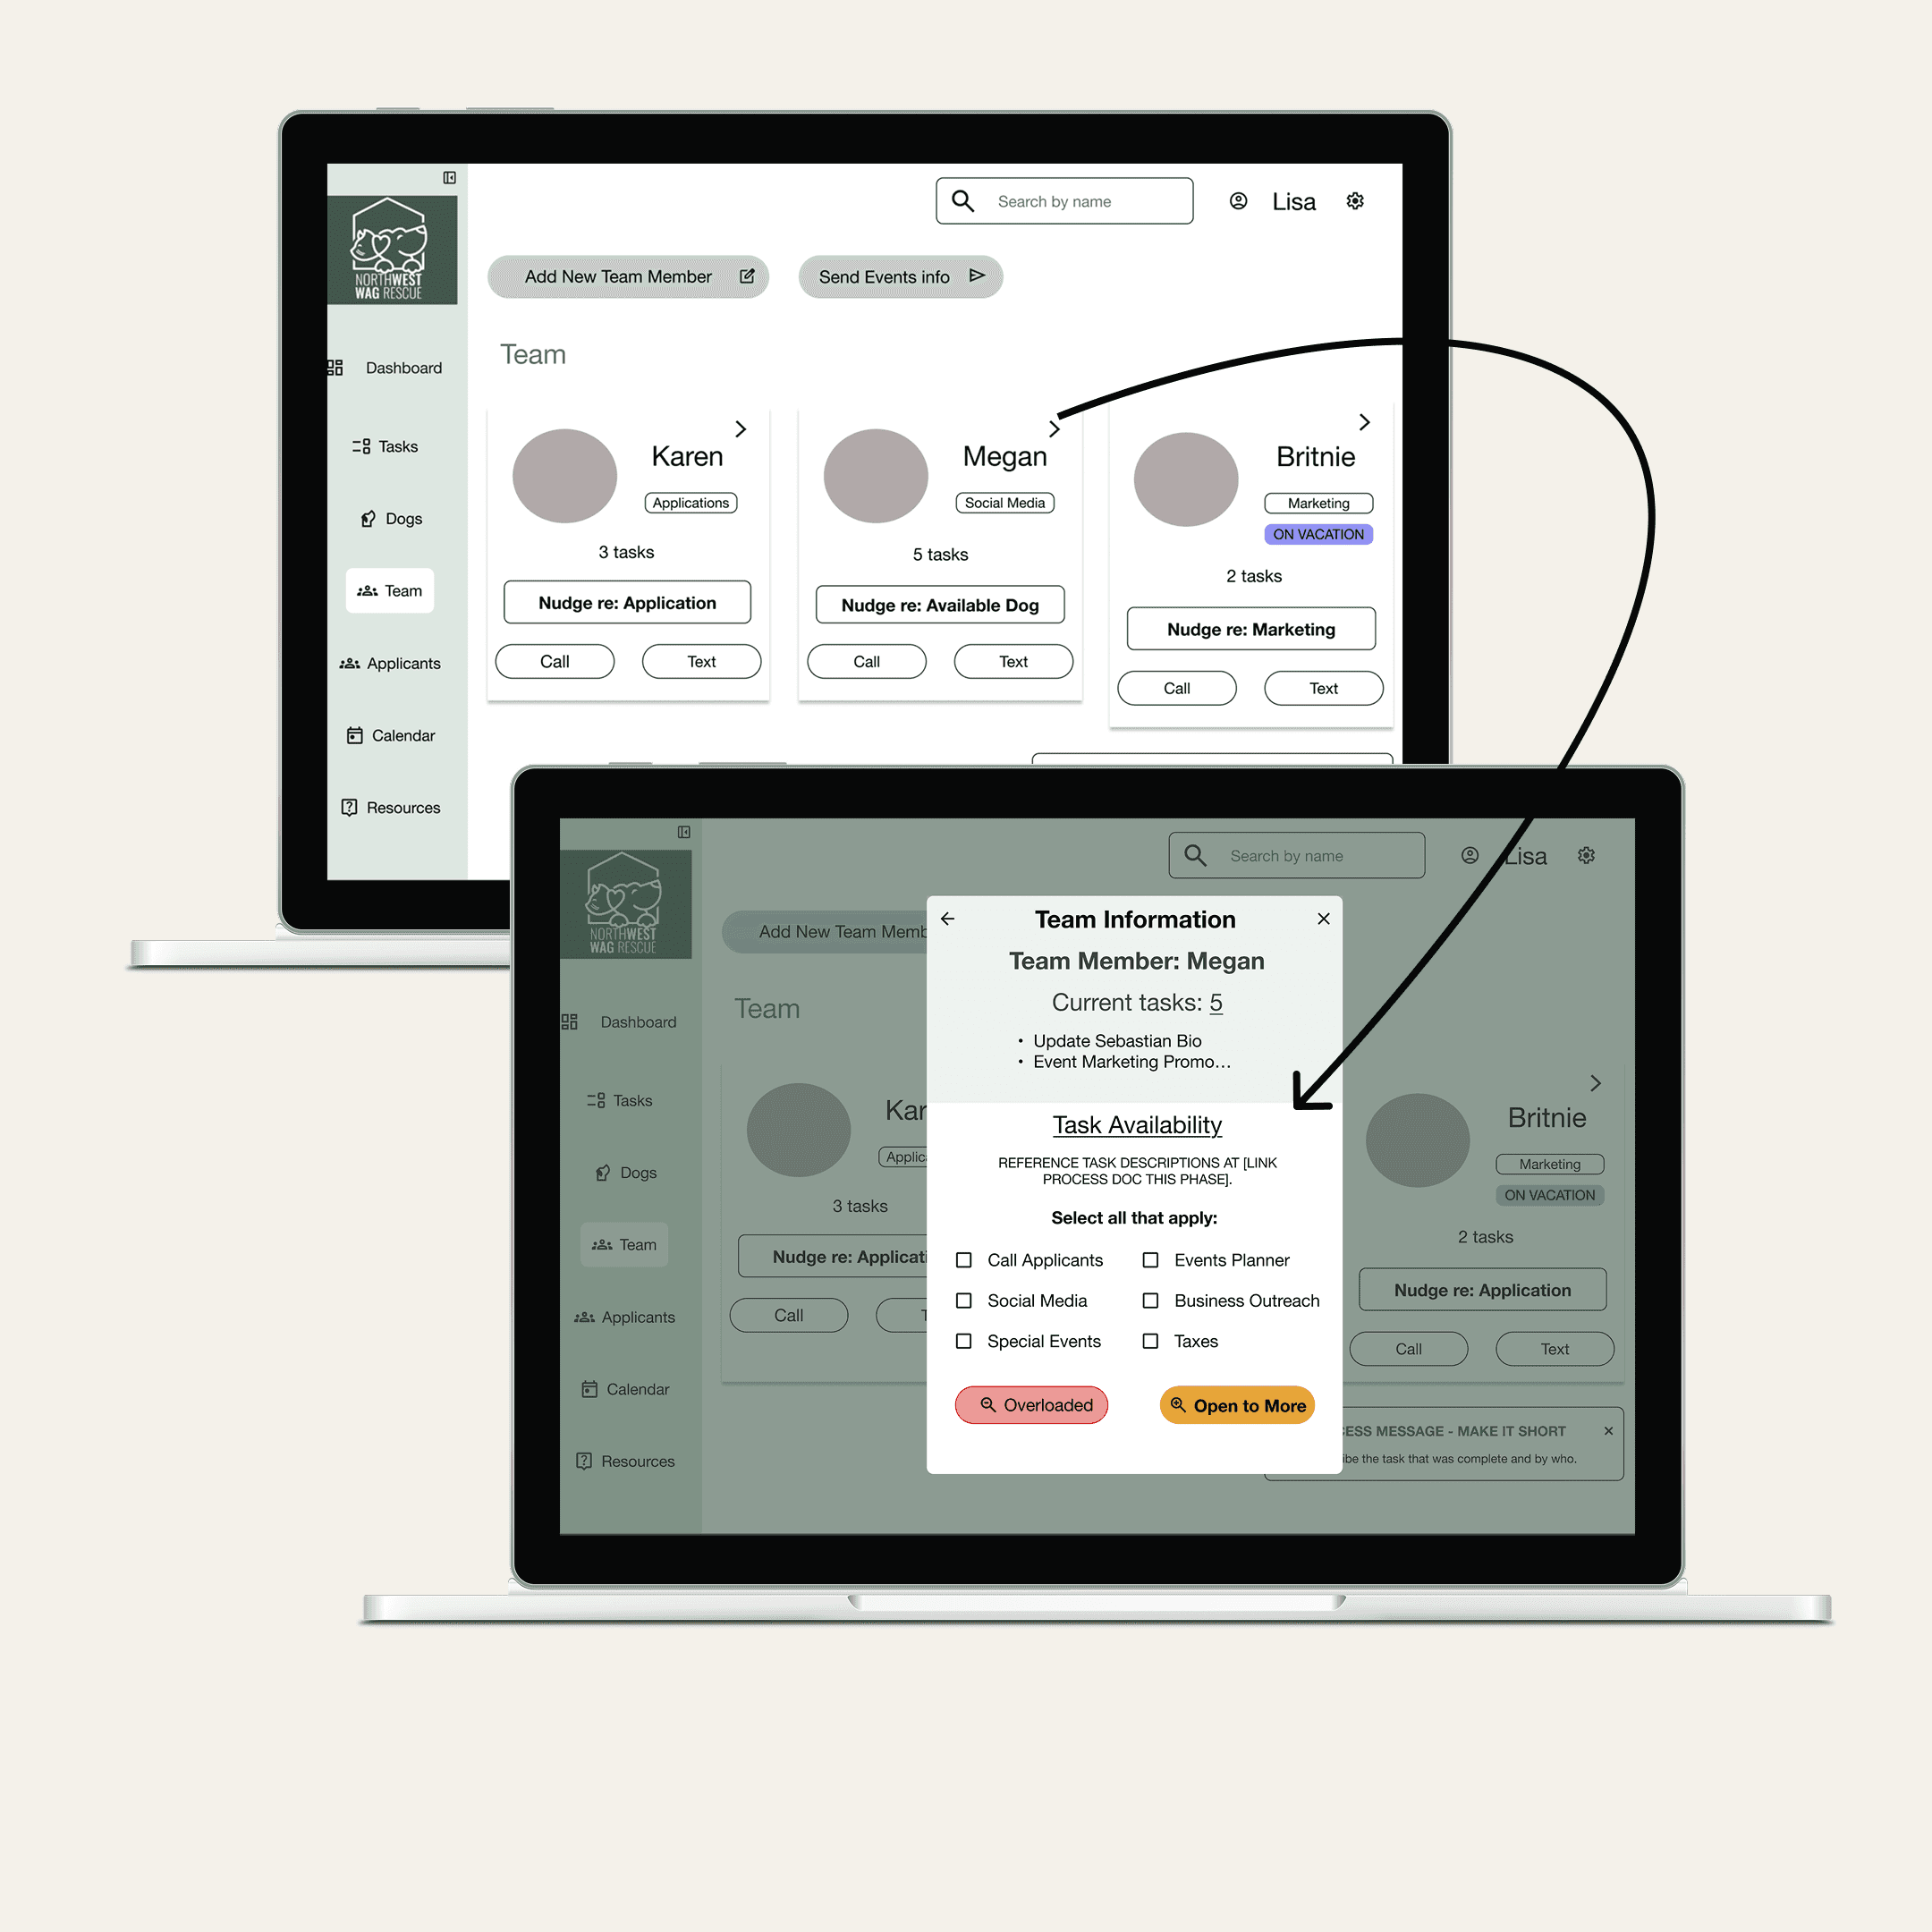
I also introduced two new pop up screens to support task completion:
Team's task: Adjusting a volunteer’s workload
Applicant's task: Completing an applicant’s review
Added Deny button on applicants
Added vacation tag on Team's page.
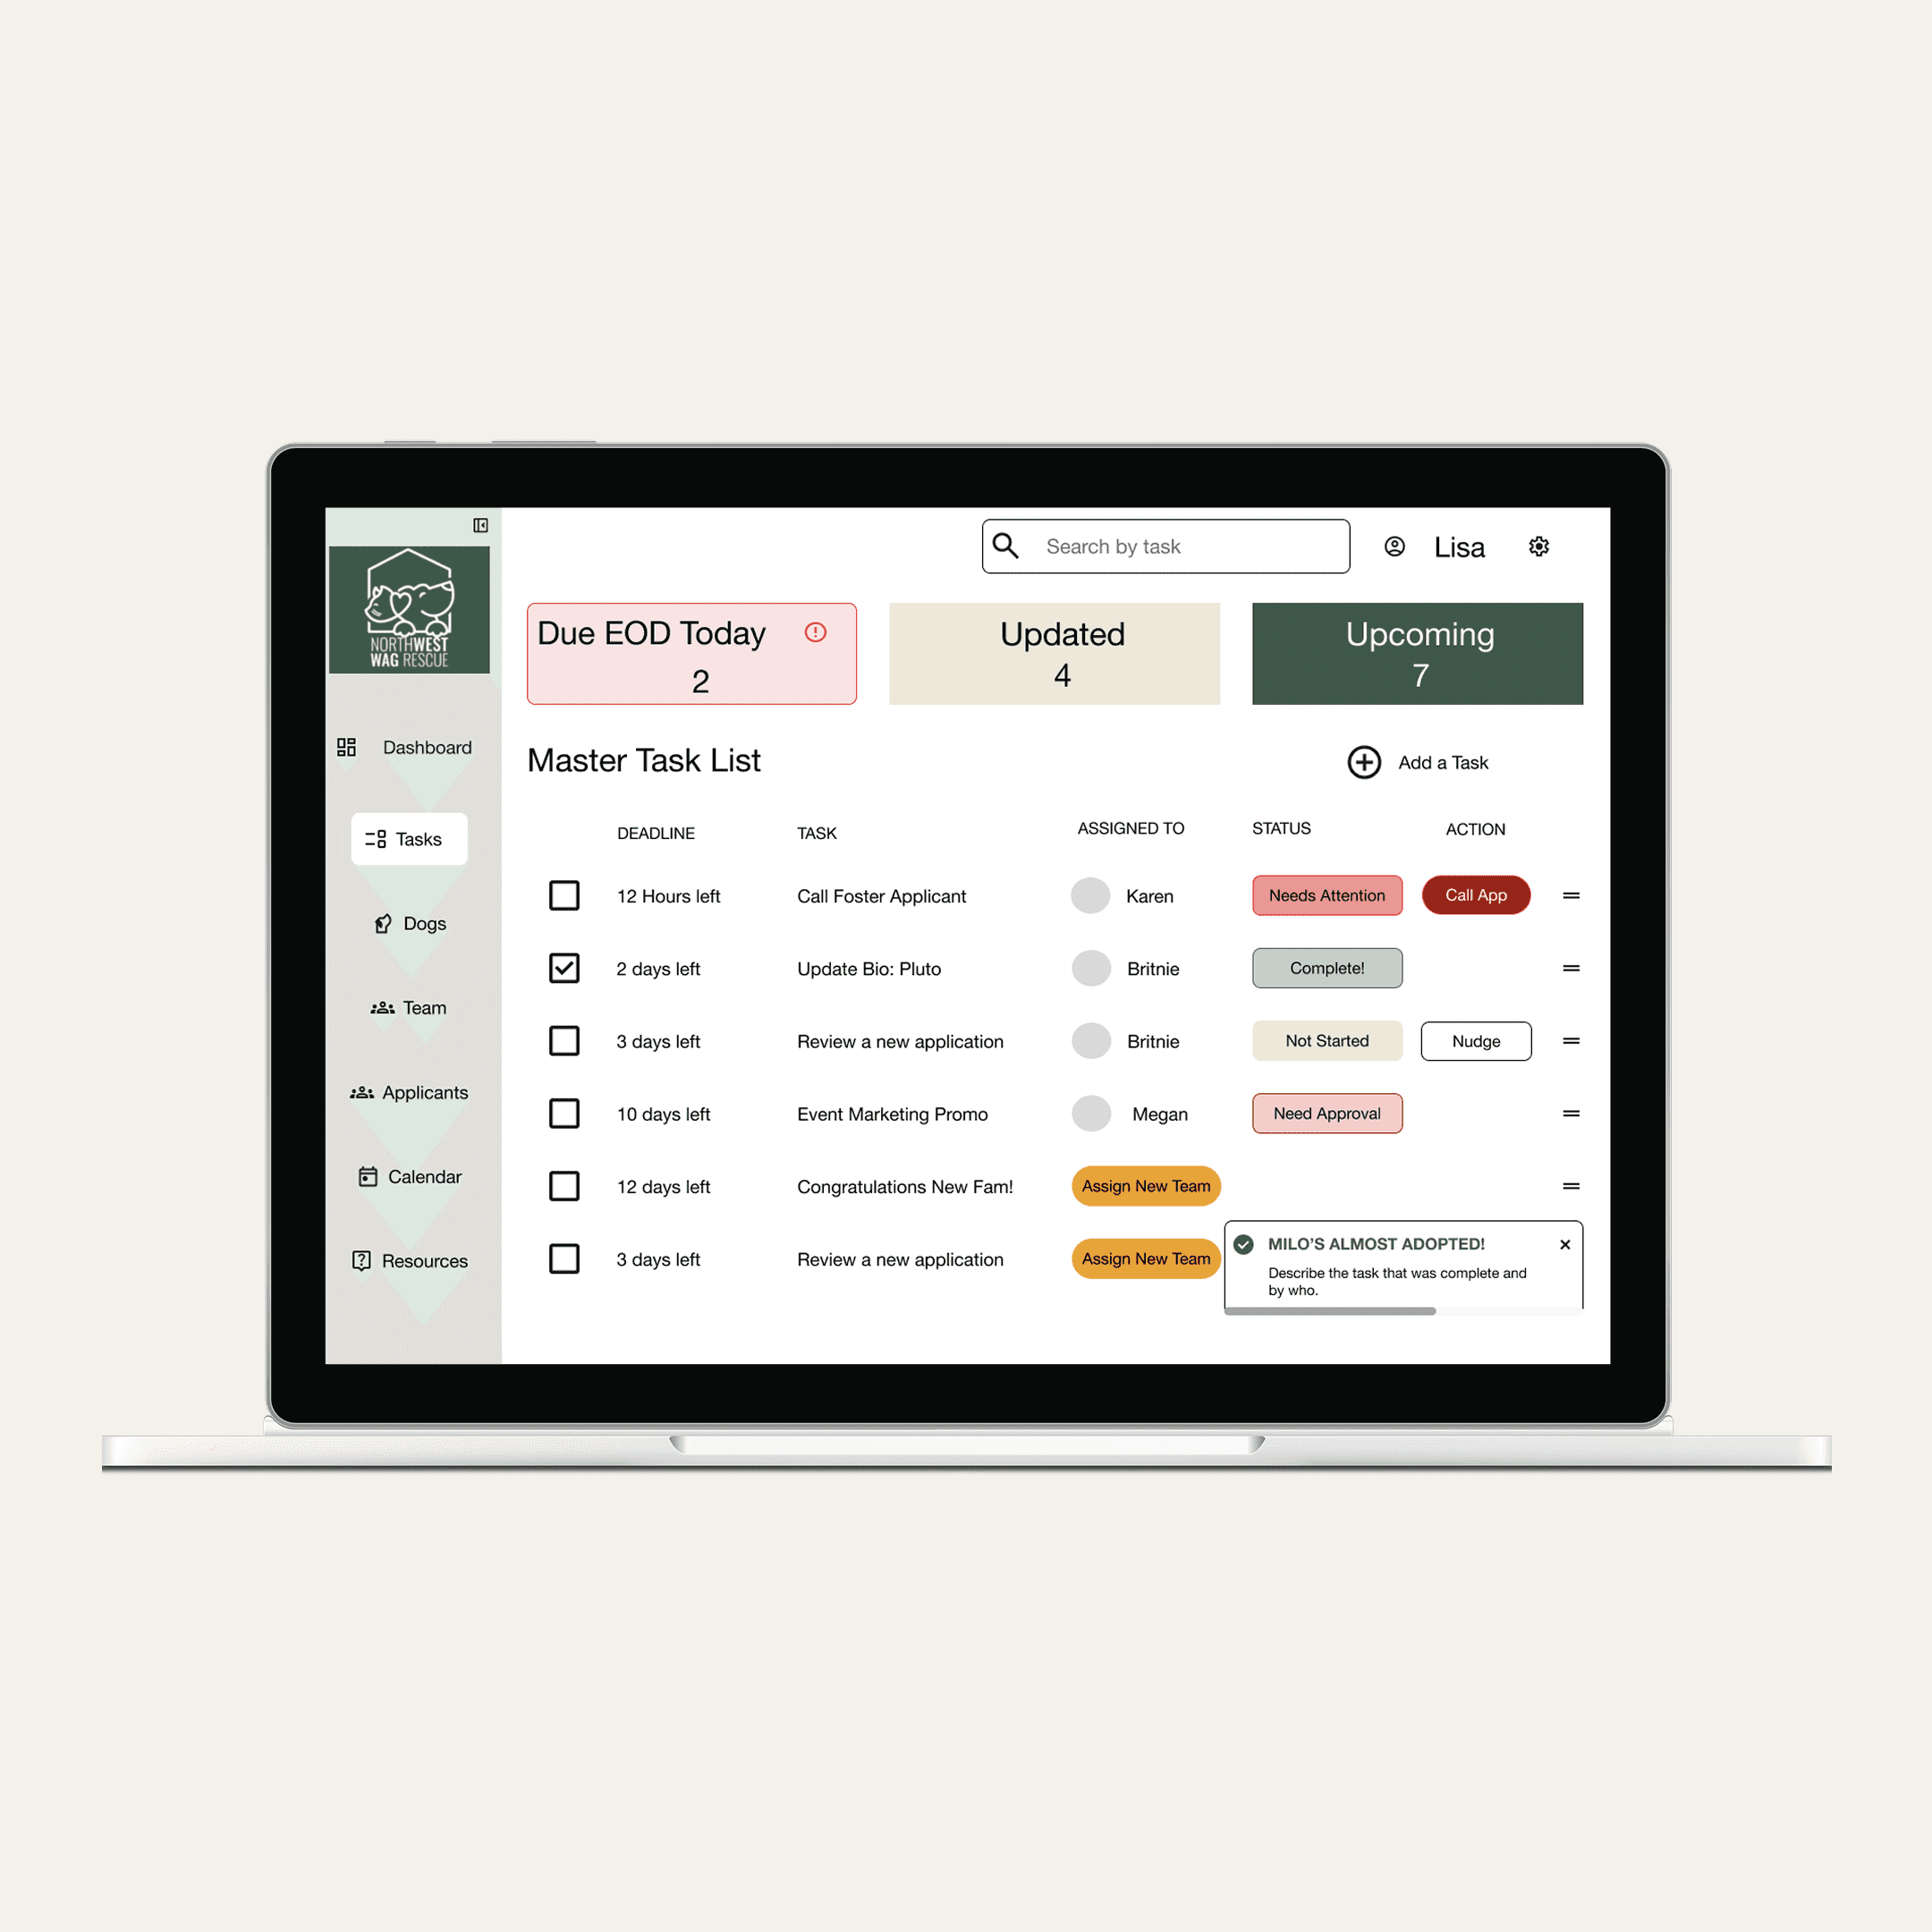
Final Designs
Home Dashboard

Dog's Profile

Applicants & Review Pages
Team Page & Task Load
Events Calendar
Master Task List
Play with the Prototype:
Key Takeaways & What I Learned
This project taught me how to design with clarity for a small but mighty team juggling daily operations, volunteer coordination, and long-term goals. By listening closely to users and simplifying what matters most, I created a system that fits seamlessly into their day.
What I’m most proud of is that this dashboard doesn’t just look good—it works hard. It turns scattered tools and manual tasks into a focused experience that saves time and reduces stress.
The biggest win?
We’re moving forward with implementation!
This means the nonprofit owner can regain time and team volunteer feel empowered to do work confidently and efficiently. For me, that’s the kind of impact I want to keep designing for.
Thanks for reading! Ready to elevate your operations??
Explore Other Work

© 2025 Brianna Maurer